
NTTO Publishes 2025 Results of the Survey of International Air Travelers
Date postedMay 28, 2026
NTTO Publishes Calendar Year 2025 Survey of International Air Travelers (SIAT) Inbound Results
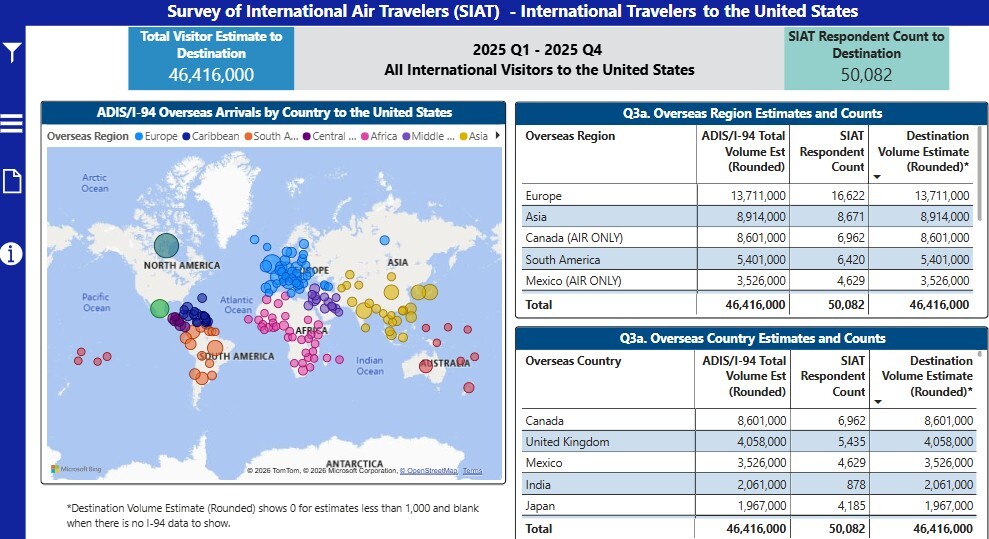
The International Trade Administration’s National Travel and Tourism Office (NTTO) released the results of the inbound Survey of International Air Travelers (SIAT) covering calendar year 2025. In 2025, 46.4 million international inbound air travelers from Canada, Mexico and overseas visited the United States.
International Inbound Air Travelers To the United States in 2025
- Top-line characteristics of the 34.3 million overseas visitor arrivals to the United States:
- The average overseas visitor made the decision to visit the United States 104 days prior to the trip and made an airline reservation 79 days prior to the trip.
- The average overseas visitor had a combined annual household income of $90,880, stayed 16.9 nights and spent $1,829 while in the United States.
- 58.6 percent traveled alone, 21.4 percent traveled with a spouse/partner, and 18.3 percent traveled with family/relatives.
- 73.7 percent rated the overall entry experience to the United States as either good or excellent; 97.2 percent reported that their trip either met or exceeded their expectations; and 96 percent expect to visit the United States again.
- Vacation/Holiday was the top main purpose of the trip (57.1 percent), followed by Visit Friends/Relatives (22.2 percent), and Business (16.4 percent).
- Shopping (82.9 percent) was the top leisure activity engaged, followed by Sightseeing (77.8 percent), National Parks/Monuments (33.9 percent), Art Galleries/Museums (28.3 percent), and Small Towns/Countryside (27.6 percent).
- Hotel or Motel, etc. (71.4 percent) was the top type of accommodation used, while Auto (Private or Company) (34.6 percent) was the top type of transportation used in the United States.
- On average 1.4 states were visited, with 75.4 percent visiting one state, 14.9 percent visiting two states and 9.7 percent visiting three states or more.
- The United Kingdom (4.1 million visitor arrivals) was the top source market, followed by India (2.1 million), Japan (2.0 million), Brazil (1.9 million), and Germany (1.8 million).
- Florida (9.3 million) was the top state visited, followed by New York (9.1 million), California (6.6 million), Nevada (2.3 million), and Texas (1.9 million).
- Top-line characteristics of the 8.6 million Canadian-air visitor arrivals to the United States:
- The average Canadian-air visitor made the decision to visit the United States 81 days prior to the trip and made an airline reservation 59 days prior to the trip.
- The average Canadian-air visitor had a combined annual household income of $132,375, stayed 7.8 nights and spent $1,037 while in the United States.
- 61.2 percent traveled alone, 22.3 percent traveled with a spouse/partner, and 15.4 percent traveled with family/relatives.
- 73.7 percent rated the overall entry experience to the United States as either good or excellent; 98.1 percent reported that their trip either met or exceeded their expectations; and 91.4 percent expect to visit the United States again.
- Vacation/Holiday was the top main purpose of the trip (53.2 percent), followed by Visit Friends/Relatives (23.1 percent), and Business (20.6 percent).
- Shopping (67.3 percent) was the top leisure activity engaged, followed by Sightseeing (63.9 percent), Experience Fine Dining (26.9 percent), Amusement/Theme Parks (19.7 percent), and Small Towns/Countryside (18.5 percent).
- Hotel or Motel, etc. (71.8 percent) was the top type of accommodation used, while Ride Sharing Service (38.3 percent) was the top type of transportation used in the United States.
- On average 1.4 states were visited, with 72.9 percent visiting one state, 16 percent visiting two states and 11.1 percent visiting three states or more.
- Florida (2.6 million) was the top state visited, followed by California (1.5 million), Nevada (1.0 million), New York (990,000), and Texas (483,000).
- Top-line characteristics of the 3.5 million Mexican-air visitor arrivals to the United States:
- The average Mexico-air visitor made the decision to visit the United States 70 days prior to the trip and made an airline reservation 49 days prior to the trip.
- The average Mexico-air visitor had a combined annual household income of $71,262, stayed 11.8 nights and spent $1,314 while in the United States.
- 61.4 percent traveled alone, 20 percent traveled with family/relatives, and 17.1 percent traveled with a spouse/partner.
- 84.4 percent rated the overall entry experience to the United States as either good or excellent; 98.3 percent reported that their trip either met or exceeded their expectations; and 97.9 percent expect to visit the United States again.
- Vacation/Holiday was the top main purpose of the trip (59.6 percent), followed by Visit Friends/Relatives (20.1 percent), and Business (17.2 percent).
- Shopping (81 percent) was the top leisure activity engaged, followed by Sightseeing (65.8 percent), Amusement/Theme Parks (31.5 percent), National Parks/Monuments (28.1 percent), and Art Galleries/Museums (24 percent).
- Hotel or Motel, etc. (66.7 percent) was the top type of accommodation used, while Auto (Private or Company) (40.7 percent) was the top type of transportation used in the United States.
- On average 1.6 states were visited, with 66.2 percent visiting one state, 20.4 percent visiting two states and 13.4 percent visiting three states or more.
- California (707,000) was the top state visited, followed by Florida (608,000), Texas (548,000), Nevada (385,000), and New York (358,000).
How to Access 2025 Inbound SIAT Statistics
- The SIAT Inbound Survey Monitor is an interactive tool to analyze the characteristics of international inbound air visitors at the country or world region level on an annual or quarterly basis from 2012 to present.
- The Inbound SIAT National Reports include quarterly and annual SIAT results for:
- Overseas: containing 4 Banners each containing 40 tables: Banner 1 (Total Overseas), Banner 2 (European Countries/Regions), Banner 3 (Asian Countries/Regions), and Banner 4 (Latin Countries/Regions).
- Canada-air: containing 1 Banner containing 40 tables
- Mexico-air: containing 1 Banner containing 40 tables
NTTO is scheduled to report on the annual characteristics of Canada-land and Mexico-land visitors to the United States for calendar year 2025 in the near future.